Category Archives: spectroscopy

spectroscopic techniques used in chemistry

GC-MS Analysis of Bunkers

There has been much discussion recently on LinkedIn (see ref 1 and ref 2) about using GC-MS to analyse marine bunker fuels and whether this should be a routine test.

Firstly GC-MS is a fairly generic term covering a variety of techniques within that label such as

  • Headspace GC-MS
  • Direct Injection GC-MS
  • Direct injection GC-MS with derivatisation of the sample
  • Sample extraction with or without sample derivatisation GC-MS (“polars” analysis)

All of these will provide some information about the composition of the fuel, but none will provide every bit of compositional information.

Continue reading GC-MS Analysis of Bunkerslinkedin

HPLC – Chemical Analysis Available

Exciting news for Christmas: SMS now have a High Performance Liquid Chromatography (HPLC) system to complement the existing range of other chromatographic techniques that we offer our customers.

The HPLC system comprises Pump with ternary solvent input, solvent de-gasser, UV detector, column oven and data system. Future expansion options might include a Fluorescence detector.

Examples of additional types of work we can now offer include:

  • Euromarker detection in Gas Oils (e.g Red Diesel) and kerosene
  • PAH analysis
  • identification of oxidation products from antioxidants used in polymers which can cause discoloration issues

HPLC System

SMS Analytical’s HPLC System

linkedin

Kerosene and Diesel Fuel Analysis By GCMS

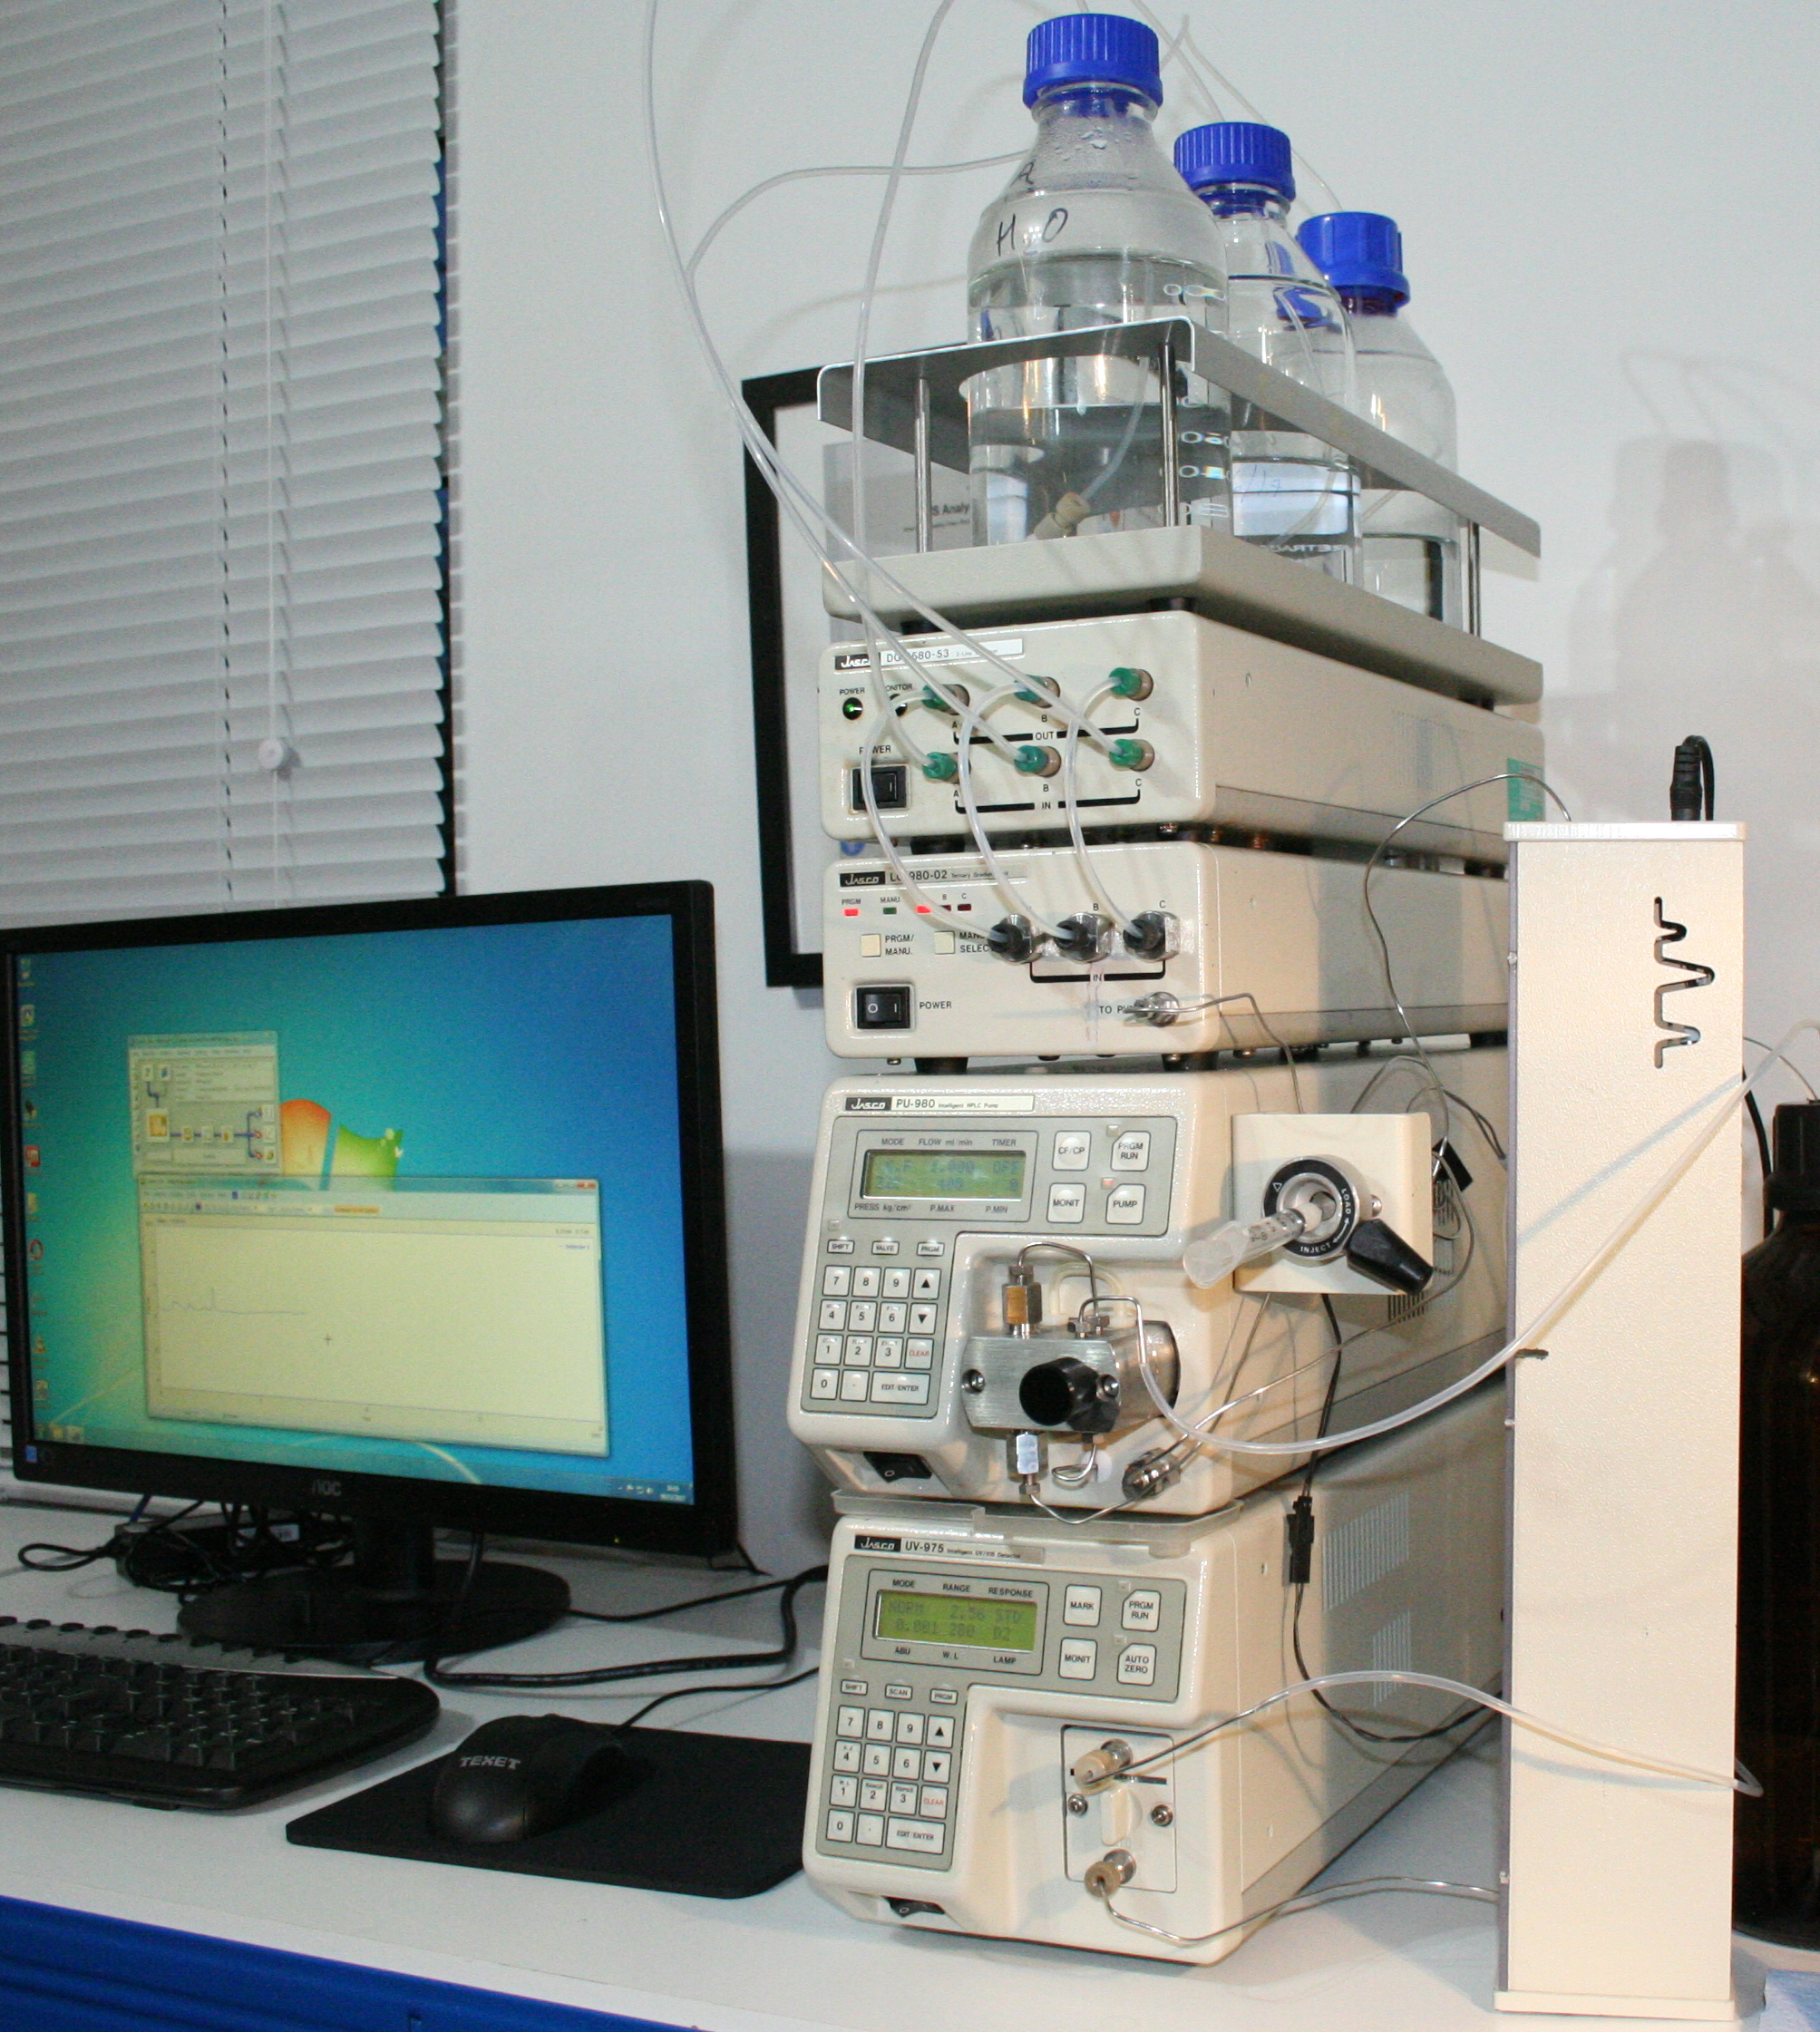
In this article we show how we examine Kerosene  and Diesel fuel using GCMS.

Kerosene

Here is a typical chromatogram of a kerosene using a Mass Spectrometer as the detector. The number and distribution of the peaks forms a fingerprint of the fuel.

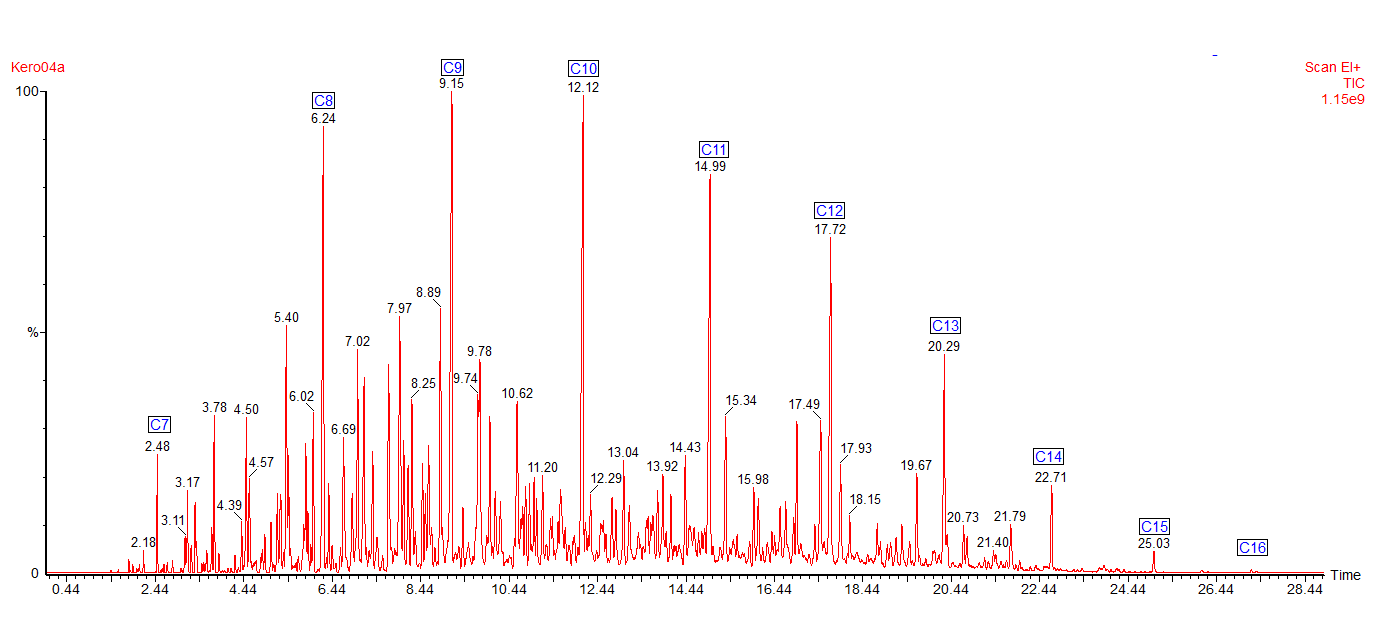
The chromatogram shows all the major peaks showing that this kerosene has an alkane range from heptane (C7) to hexadecane (C16). Kerosene contains different types of hydrocarbons: alkanes (or paraffins), cycloalkanes (also called naphthenes) and aromatics.

We can use selective ion monitoring to separate out these different classes of compounds.

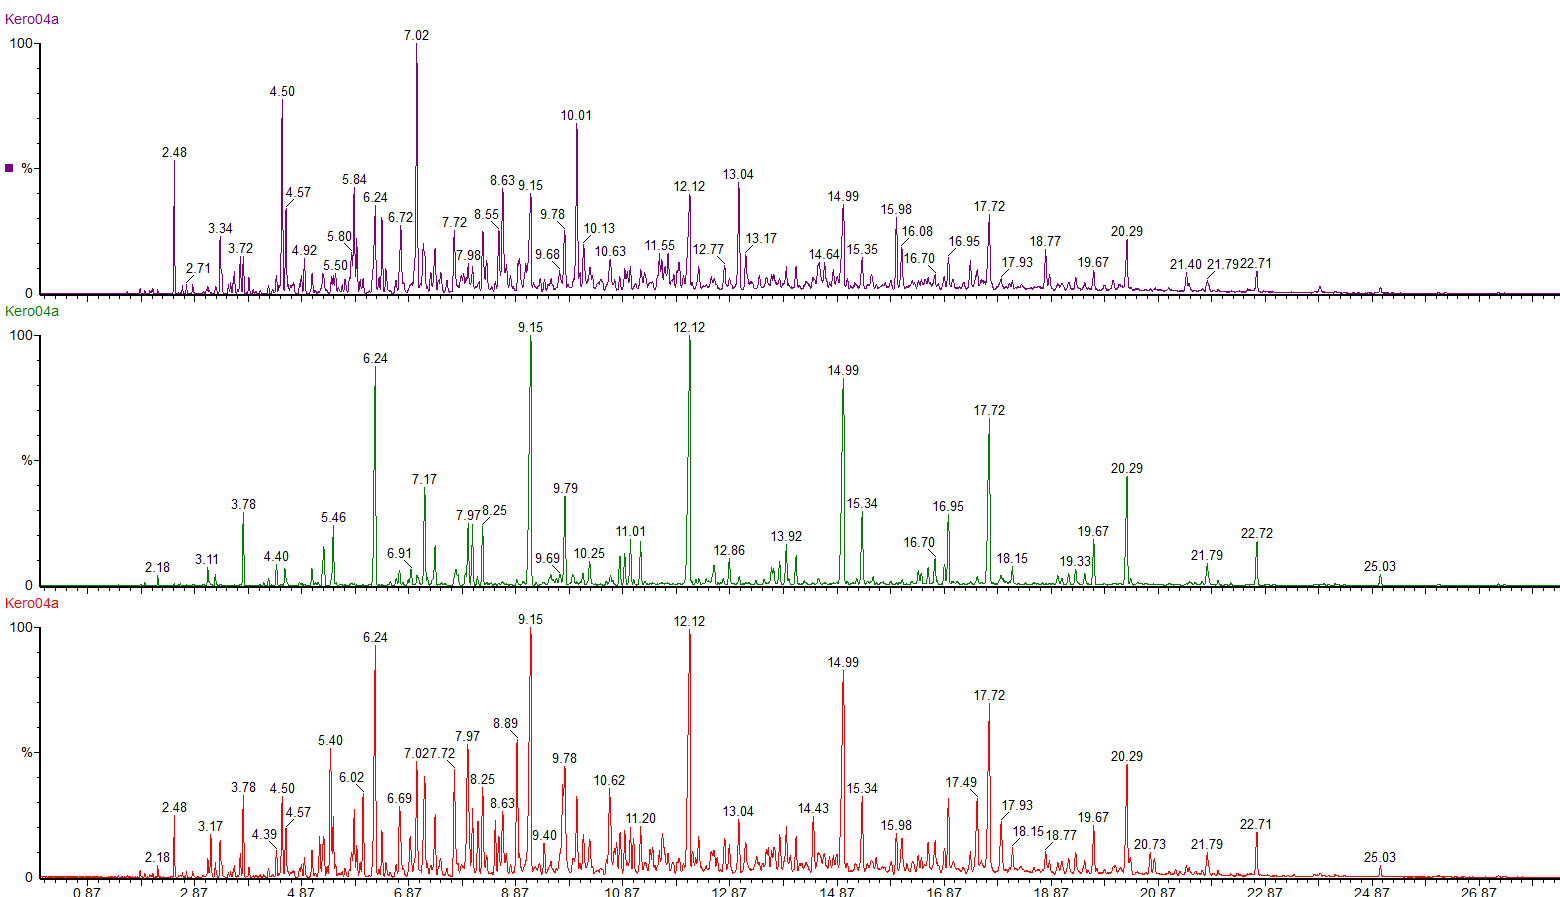
The red chromatogram shows the whole range of compounds in the kerosene. By using selected ions we can see the straight chain and branched chain alkanes (green chromatogram) and the profile of the cycloalkanes (purple chromatogram).

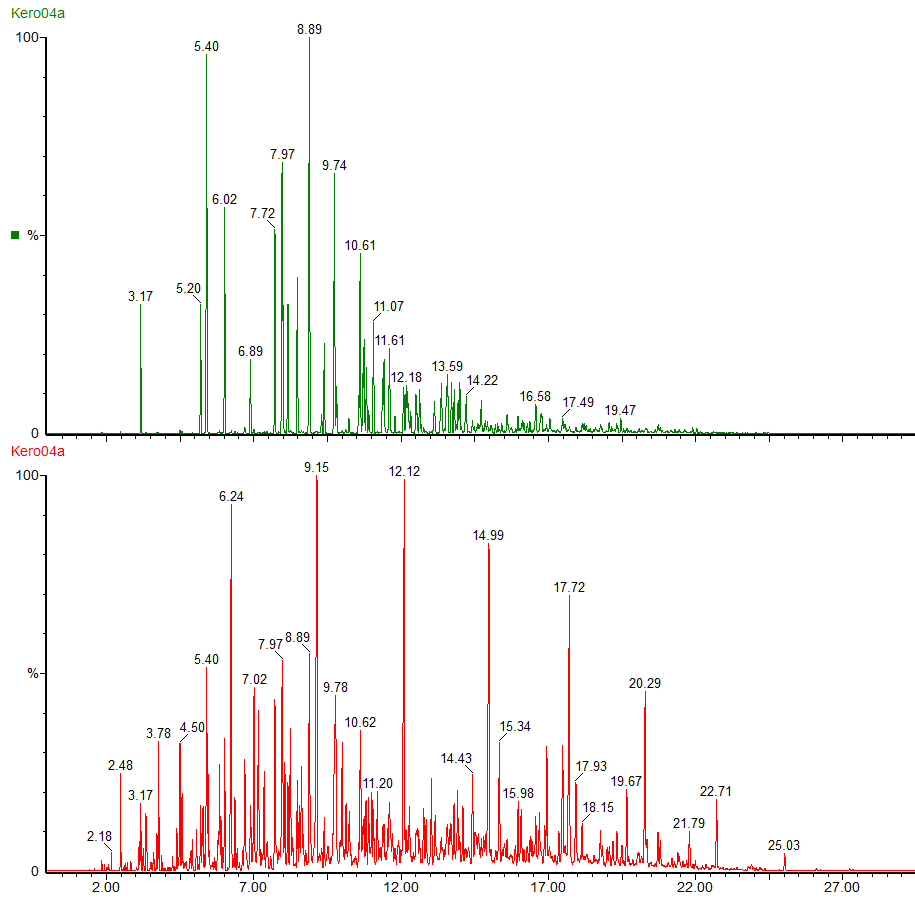
The green chromatogram shows the alkylbenzenes present in the kerosene, ranging from toluene to C6 alkyl benzenes.
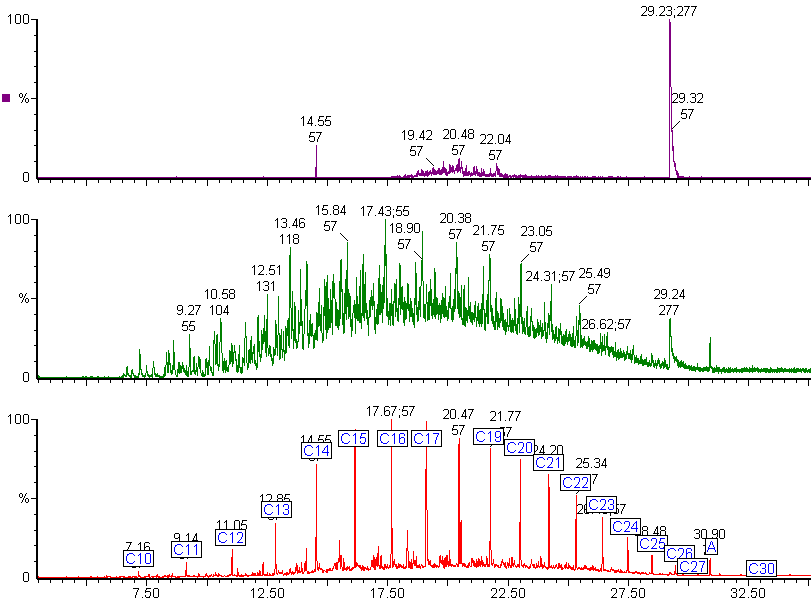
Diesel Fuel

Diesel fuel shows a mixture of hydrocarbons with a wider boiling range.

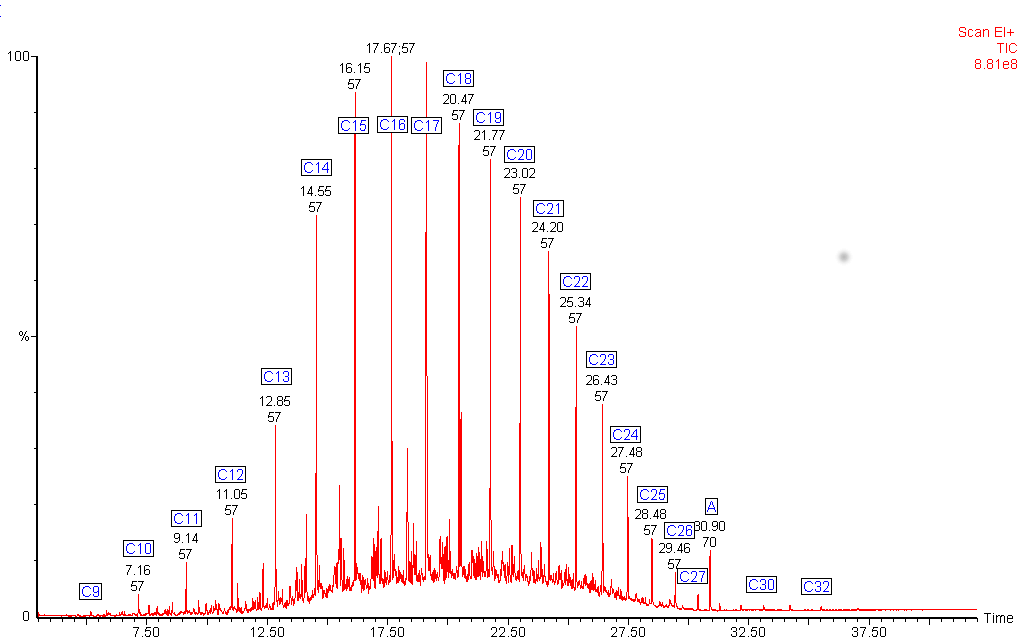
The alkanes in this diesel fuel range from nonane (C9) to dotriacontane (C32). The chromatogram shows an unexpected peak (labelled A). The mass spectrum from this peak identified it as di-octyl phthalate, a common plasticiser often found in plastic containers.

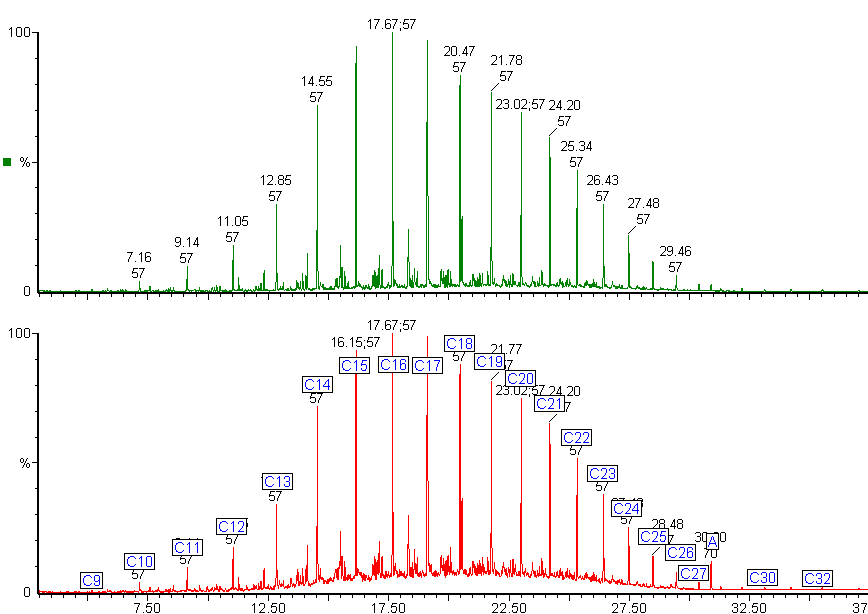
The green chromatogram shows the alkane distribution in the diesel fuel.

Sometimes contaminants are not seen in the main chromatogram because the hydrocarbons overlap the contaminant peak.

Selective ion monitoring can reveal contaminants.


The green chromatogram shows the selected ion chromatogram for alkyl benzenes. The peak at 29.24 min is unusual and indicates a possible contaminant. By checking the mass spectrum of this peak against the NIST mass spectral library, we found a match with triphenylphosphine oxide, which is not a normal component of diesel fuel.

The purple chromatogram shows the same peak is present in the chromatogram produced for the two main fragment ions for triphenylphosphine oxide.linkedin

FTIR Acquisition

cary 630 FTIR

Our latest analytical acquisition, an Agilent Cary 630 FTIR with diamond ATR is proving remarkably sensitive – a real advantage when analysing small quantities of sample. The whole instrument only has the bench foot print of about 2 CDs and is light enough to be used in the field as well:

cary 630 FTIR

Cary 630 FTIR


We purchased the instrument with a KBr optics option rather than ZnSe as we wanted to scan over a larger range and don’t intend taking the instrument into high humidity environments. Although this purchase was for the ATR module, there are a variety of other modules for liquid samples and quantitative analysis which are easily interchanged.

Polystyrene Spectrum Picture

Polystyrene Calibration Spectrum


The equipment has already proved its worth in analysing thin deposits on paint surfaces and in analysing minute powder deposits on electrical cabling :

White Deposit on Electrical Cable Picture

White Deposit on Electrical Cable


MicroLab Picture

MicroLab

We have found that the quality of the spectra from particulates of about 500microns or even less has been excellent. The sample spectrum (in red, above) was obtained from just two barely visible particles each of about 200 microns diameter, taken from the electrical cabling shown above. From elemental analysis using SEM-EDX, the material was known to be a mixture and, unsurprisingly, the library match wasn’t particularly good. However the FTIR data, together with the elemental analysis was sufficient to conclude that the source of the white powder was from a powder fire extinguisher.

Our Conclusion

The short path length within this instrument gives quick and impressive results using only a small amount of bench space. However, having already used Agilent FTIRs with Resolutions Pro software in the past our biggest wish with this instrument is that we could directly control the data collection from Resolutions Pro software rather than the ‘simple’ MicroLab software which we don’t like – it is more limited in functionality and easy to get lost within the series of screens. Instead we have to pass the data via the Resolutions Pro launcher button every time we wish to anything useful with a spectrum and the two pieces of software store data in different Windows file paths as well as being very different in their design’s look and feel.

Overall this instrument does a very good job for a sensible price and is only let down, in our view, by the MicroLab software. For those on a small budget one can start with a single attachment and buy others later.

Contact SMS For Analysis Quotelinkedin