Nylon bags are frequently used in fire investigations to preserve samples such as fire debris for later analysis. They are considered to have very good resistance to vapour loss [1]. However, this does not mean that they hold onto all vapours forever, and this could make the difference between detecting accelerants or not, or mis-identifying the type of accelerant.
We showed in an earlier blog the type of profile seen for petrol (gasoline) vapours. Petrol and volatile solvents, such as naphthas are the most vulnerable to vapour loss because the molecules are very small and can diffuse through the polymer into the air.
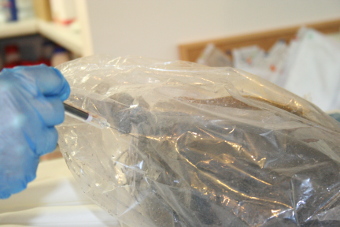
We used bags from 2 different suppliers, adding 1µl of a synthetic mix of hydrocarbons in the gasoline boiling range to dry cellulose fabric, sealing the bag with a ‘swan-neck’ cable tie closure and encasing the bag with a second bag, also sealed with a swan-neck closure. The bags were then stored at ambient temperatures and the atmosphere inside each inner and outer bag tested after 20 days.
We used a synthetic mix in order to see if particular types of hydrocarbons migrated through preferentially.
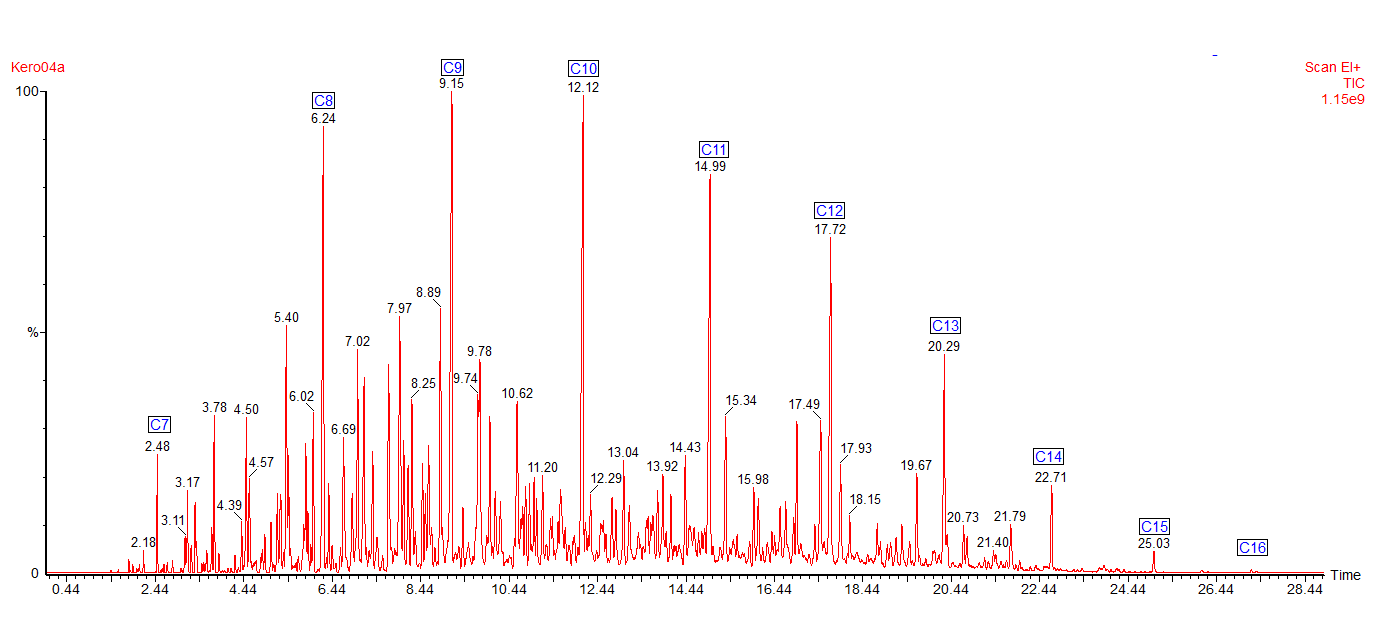
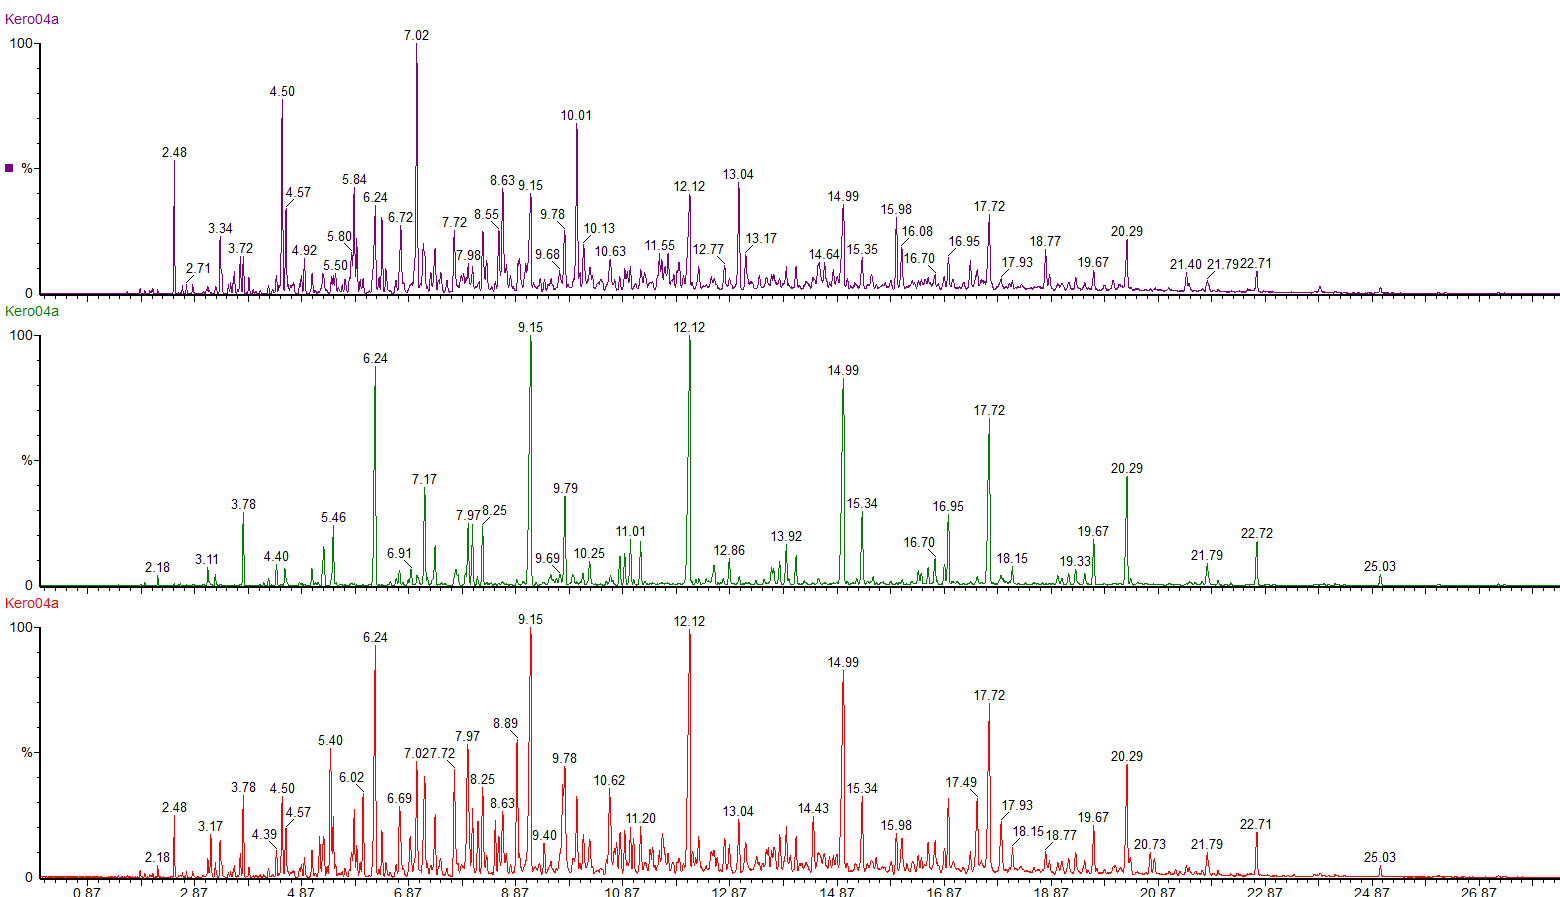
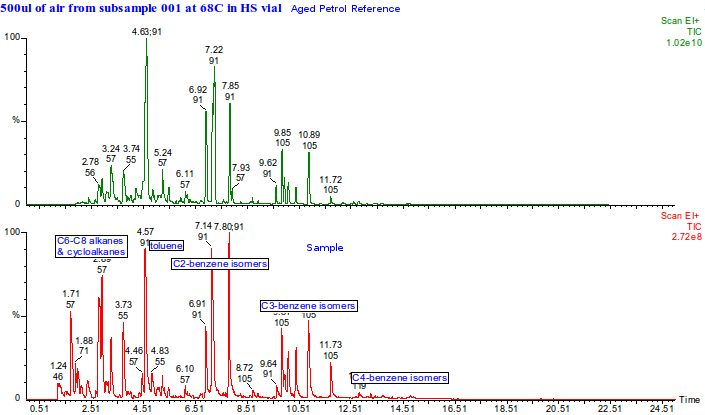
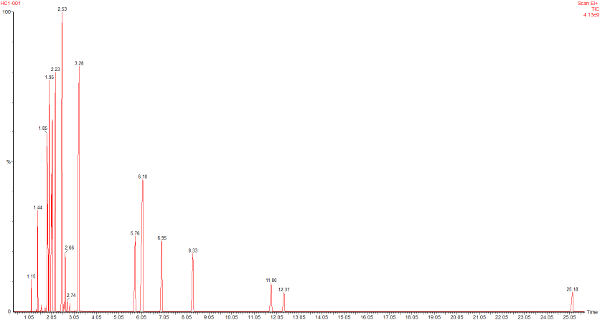
This is the headspace GC-MS chromatogram of the synthetic mix (red chromatogram), showing C0-C3 aromatics (benzene through to trimethylbenzene) in the green chromatogram, alkanes from C5 pentane to C12 dodecane (purple chromatogram) and cycloalkanes and alkenes (C5 to C8) in the black chromatogram. The total aromatics content of the mix was 34%, similar to petrol.
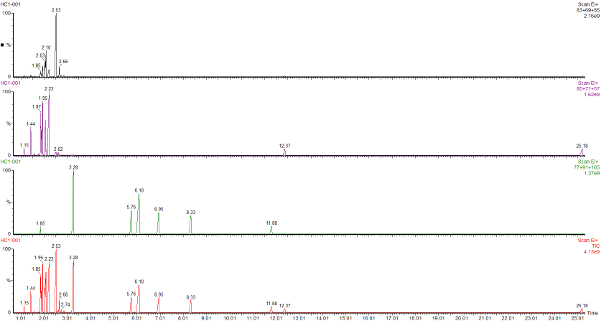
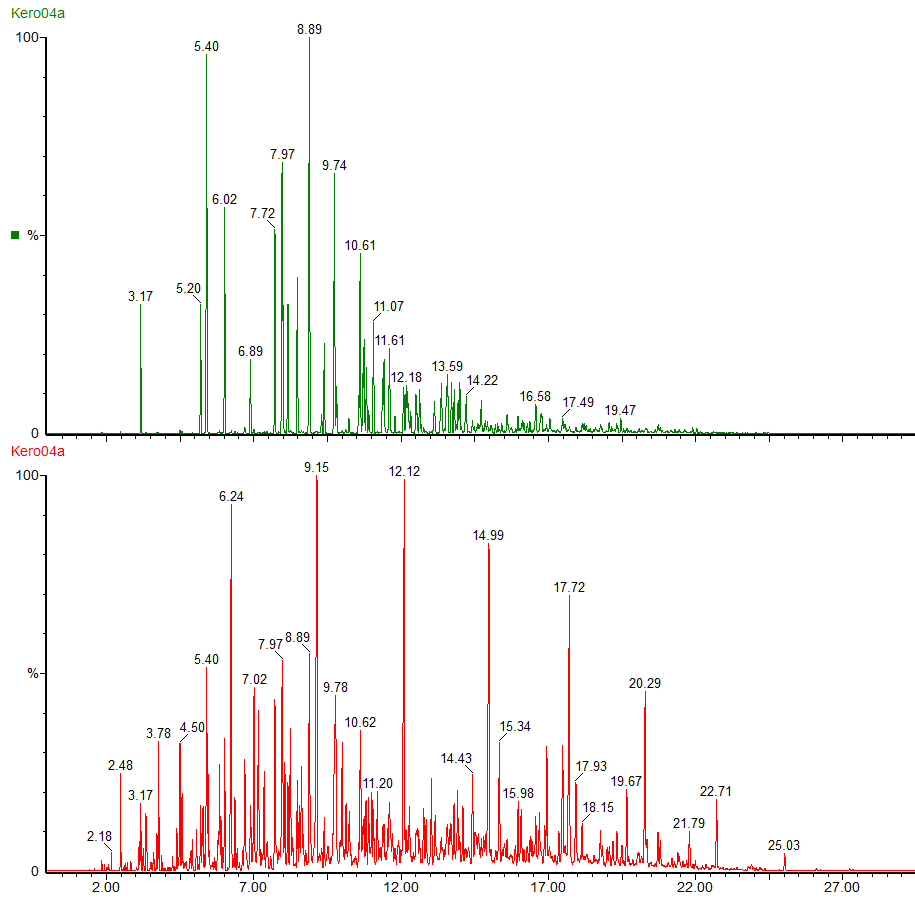
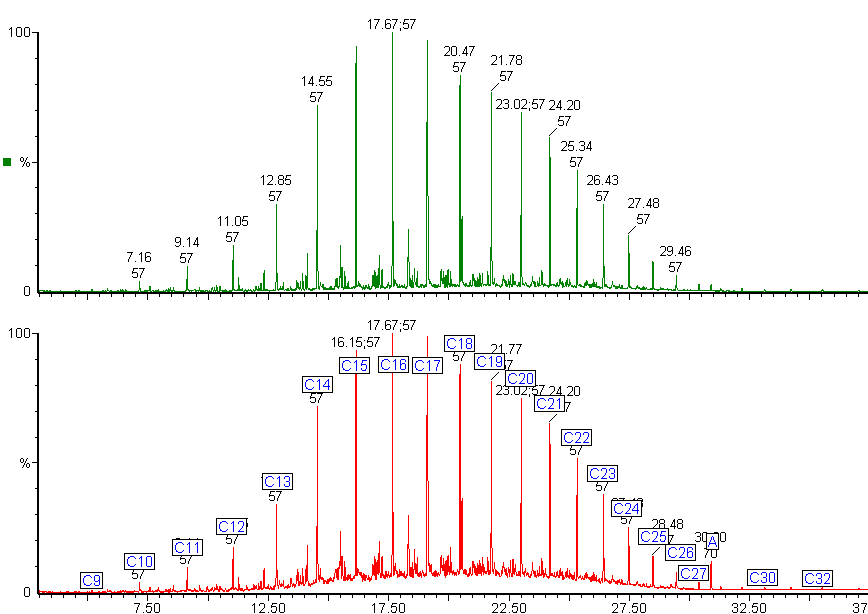
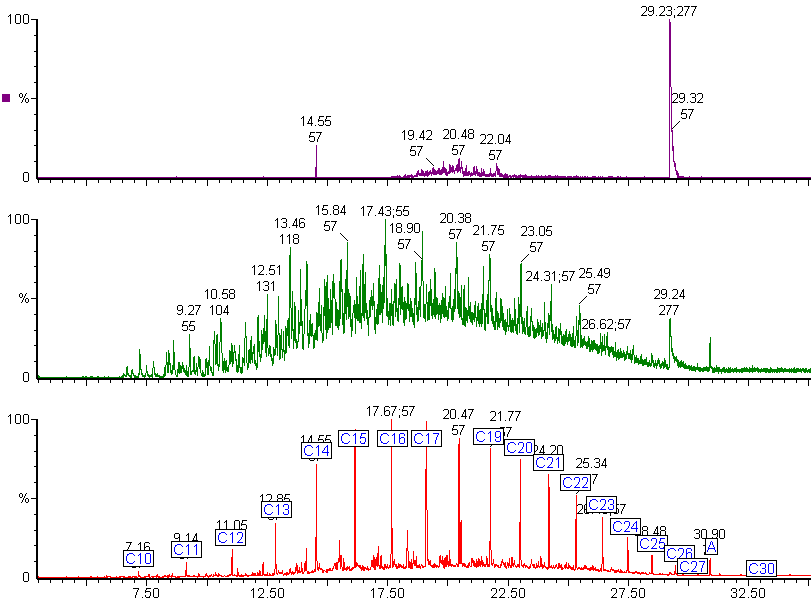
Here are the chromatograms of the vapour from the inner and outer bags after 20 days ambient storage.
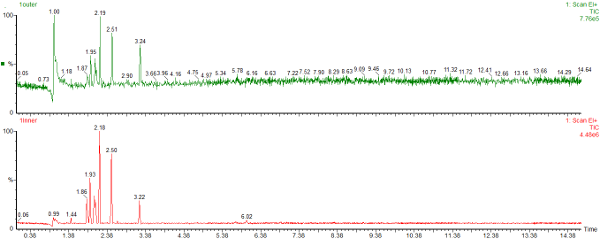
Nylon Bag 1
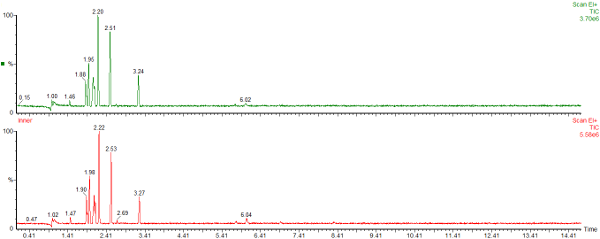
Nylon Bag 2
The red chromatogram is vapour from the Inner bag and the green chromatogram is for vapour sampled from the Outer bag.
After 20 days the levels of vapour in the inner bags were significantly lower than the vapour concentrations immediately after sealing the bags. The concentration of vapour in the outer bags was lower than for the inner bags and there appears to be a preferential loss of aromatic hydrocarbons. This could affect the interpretation of the analysis as the presence of the C1 and C2-benzenes in particular helps to define whether petrol (gasoline) is present or not.
In both the types of nylon bags used, volatile hydrocarbons permeated or diffused through to the outer bag, and onwards to the atmosphere from the outer bag. But is this because of the inefficiency of the swan-neck closure, allowing volatiles to escape from the bag, or are the hydrocarbons permeating through the polymer bag itself ? [2]. We will be examining this in our next blog on this subject.
To summarise, it is best if analysis of fire debris for accelerants is carried out as soon after sample collection as possible. Contact SMS Analytical to discuss our rapid accelerant testing service.
References:
[1] E. Stauffer, JA Dolan, R Newman: Fire Debris Analysis, Academic Press, Elsevier, 2008
[2] Strijnik and Hong-You: Evaluation of the Effectiveness of Nylon Bags as Packaging for Fire Debris, 2004, Proceedings of 56th Annual Meeting of the American Academy of Forensic Sciences.